A few days ago Mark Reid wrote a post on the Current State of Telemetry Analysis, and as he mentioned in the Performance meeting earlier today we’re still working on better tooling for analyzing telemetry logs. Lately, I’ve been working on tooling to analyze telemetry logs using a pool of Amazon EC2 Spot instances (tl;dr spot instance are cheaper, but may be terminated by Amazon). So far the spot based analysis framework have been deployed to generate and maintain the telemetry dashboard (hosted at telemetry.mozilla.org). I still need to create a few helper scripts, write documentation and offer an accessible way to submit new jobs, but I hope that the general developer will be able to write and submit analysis jobs in a few weeks. Don’t worry I’ll probably do another blog post when this becomes readily available.
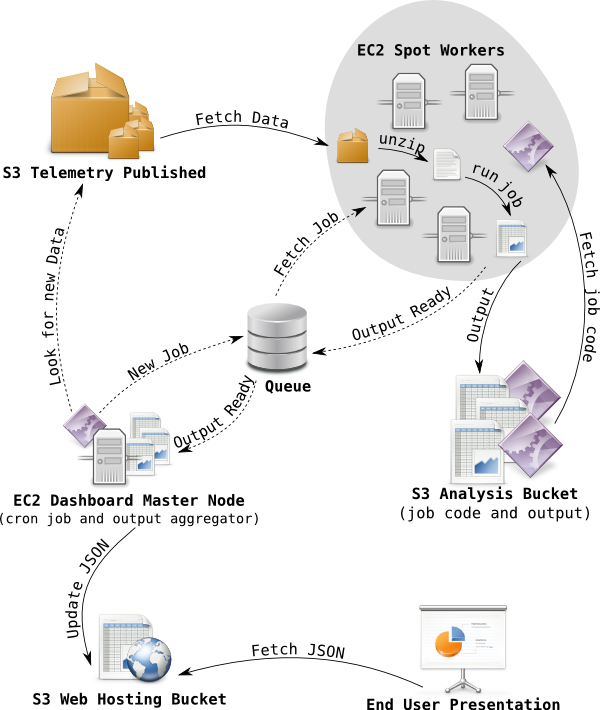
If you’re wondering how telemetry logs end up in the cloud, take a look at Mark Reids fancy diagram in the Final Countdown. Inspired by this I decided that I too needed a fancy diagram to show how the histogram aggregations for telemetry dashboard is generated. Telemetry logs are stored in an S3 bucket in LZMA compressed blocks of at most 500 MB, the files are organized in folders by reason, application, channel, version, build date, submission date, so in practice there is a lot of small files too.
To aggregate histograms across all of these blocks of telemetry logs, the dashboard master node creates a series of jobs. Each job has a list of files from S3 to process and a pointer to code to use for processing. The jobs are pushed a queue (currently SQS) from where an auto-scaling pool of spot instances fetches jobs. When a spot worker has fetched a job it downloads the associated analysis code from a special analysis bucket, it then proceeds to download the blocks of telemetry log listed in the job, and process with the analysis code. When a spot worker completes a job, it uploads the output from the analysis code to special analysis bucket, and push an output ready message to a queue.
In the next step, the dashboard master node fetchs output ready messages from the queue, downloads the output generated by the spot worker, uses it to update the JSON histogram aggregates stored in web hosting bucket used for telemetry dashboard. From here telmetry.mozilla.org fetches the histogram aggregations and presents them to the user. The fancy diagram, below outlines the flow, dashed arrows indicates messaging and not data transfer.

As I briefly mentioned, EC2 spot instances may be terminated by Amazon at any time, that’s why they are cheaper (approximately 20% of on-demand price). To avoid data loss the queue will retain messages after they’ve been fetched and requires messages to be deleted explicitly once processed, of the message isn’t deleted before some timeout, the message will be inserted back into the queue again. So if a spot instance gets terminated, the job will be reprocessed by another worker after the timeout.
By the way, did I mention that this framework processed one months telemetry logs, about 2 TB of LZMA compressed telemetry logs (approx. 20 TB uncompressed), in about 6 hours with 50 machines costing approximately 25 USD. So time and price wise it will be feasible to run an analysis job for a years worth of telemetry logs. The only problem I ran into with the dashboard is the fact that this resulted in 10,000 jobs, and each job created an output that the dashboard master node had to consume. The solution was to temporarily throw more hardware at the problem and run the output aggregation on my laptop. The dashboard master node is an m1.small EC2 node and it can easily keep up with day to day operations, as aggregation of one day only requires 500 jobs.
Anyways, you can look forward to the framework becoming more available in the coming weeks, so analyzing a few TB of telemetry logs will be very fast. In the mean time, checkout the telemetry dashboard at telemetry.mozilla.org, it has data since October 1st. I’ll probably get around to do a post on dashboard customization and aggregate consumption later, for those who would like to play the raw histogram aggregates beneath the current dashboard.