In the past quarter I’ve been working on analysis of telemetry pings for the telemetry dashboard, I previously outlined the analysis architecture here. Since then I’ve fixed bugs, ported scripts to C++, fixed more bugs and given the telemetry-dashboard a better user-interface with more features. There’s probably still a few bugs around, decent logging is still missing, but data aggregated is fairly stable and I don’t think we’re going to make major API changes anytime soon.
So I think it’s time to let others consume the aggregated histograms, enabling the creation of custom dashboard. In the following sections I’ll demonstrate how to get started with telemetry.js and build a custom filtered dashboard with CSV export.
Getting Started with telemetry.js
On the server-side the aggregated histograms for a given channel, version and measure is stored in a single JSON file. To reduce storage overhead we use a few tricks, such as translating filter-paths to identifiers, appending statistical fields at the end of a histogram array and computing bucket offsets from specification. This makes the server-side JSON files rather hard to read. Furthermore, we would like the flexibility to change this format, move files to a different server or perhaps do a binary encoding of histograms. To facilitate this, data access is separated from data storage with telemetry.js. This is a Javascript library to be included from telemetry.mozilla.org/v1/telemetry.js. We promise that best efforts will be made to ensure API compatibility of the telemetry.js version hosted at telemetry.mozilla.org.
I’ve used telemetry.js to create the primary dashboard hosted at telemetry.mozilla.org, so the API grants access to the data used here. I ‘ve also written extensive documentation for telemetry.js. To get you started consuming the aggregates presented on the telemetry dashboard, I’ve posted the snippet below to a jsfiddle. The code initializes telemetry.js, then proceeds load the evolution of a measure over build dates. Once loaded the code prints a histogram for each build date of the 'CYCLE_COLLECTOR' measure within 'nightly/27'. Feel free to give it a try…
Telemetry.init(function() {
    Telemetry.loadEvolutionOverBuilds(
        'nightly/28',        // from Telemetry.versions()
        'CYCLE_COLLECTOR',   // From Telemetry.measures('nightly/28', callback)
        function(histogramEvolution) {
            histogramEvolution.each(function(date, histogram) {
                print("--------------------------------");
                print("Date: " + date);
                print("Submissions: " + histogram.submissions());
                histogram.each(function(count, start, end) {
                    print(count + " hits between " + start + " and " + end);
                });
            });
        }
    );
});
Warning: the channel/version string and measure string shouldn’t be hardcoded. The list of channel/versions available is returned by Telemetry.versions() and Telemetry.measure('nightly/27', callback) invokes callback with a JSON object of measures available for the given version/channel (See documentation). I understand that it can be tempting to hardcode these values for some special dashboard, and while we don’t plan to remove data, it would be smart to test that the data is available and show a warning if not. Channel, version and measure names may be subject to change as they are changed in the repository.
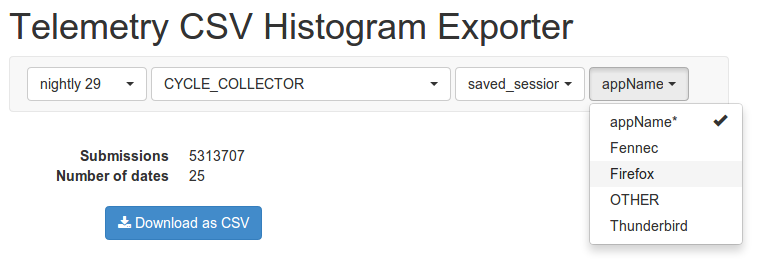
CSV Export with telemetry.jquery.js
One of the really boring and hard-to-get-right parts of the telemetry dashboard is the list of selectors used to filter histograms. Luckily, the user-interface logic for selecting channel, version, measure and applying filters is implemented as a reusable jQuery widget called telemetry.jquery.js. There’s no dependency on jQuery UI, just jquery.ui.widget.js which contains the jQuery widget factory. This library makes it very easy to write a custom dashboard if you just want write the part that presents a filtered histogram.
The snippet below shows how to create a histogramfilter widget and bind to the histogramfilterchange event, which is fired whenever the selected histogram is changed and loaded. With this setup you don’t need to worry about loading, filtering or maintaining state as the synchronizeStateWithHash option sets the filter-path as window.location.hash. If you want to have multiple instances of the histogramfilter widget, you might want to disable the synchronizeStateWithHash option, and read the state directly instead, see jQuery stateful plugins tutorial for how to get/set a option like state dynamically.
Telemetry.init(function() {

  // Create histogram-filter from jquery.telemetry.js
  $('#filters').histogramfilter({
    // Synchronize selected histogram with window.location.hash
    synchronizeStateWithHash:   true,

    // This demo fetches histograms aggregated by build date
    evolutionOver:              'Builds'
  });

  // Listen for histogram-filter changes
  $('#filters').bind('histogramfilterchange', function(event, data) {
    // Check if histogram is loaded
    if (data.histogram) {
      update(data.histogram);
    } else {
      // If data.histogram is null, then we're loading...
    }
  });

});
The options for histogramfilter is will documented in the source for telemetry.jquery.js. This file can be found in the telemetry-dashboard repository, but it should be distributed with custom dashboards, as backwards compatibility isn’t a priority for this library. There is a few extra features hidden in telemetry.jquery.js, which let’s you implement custom <select> elements, choose useful defaults, change behavior, limit available histogram kinds and a few other things.